Uploaded image for project: 'Couchbase Server'
  1. Couchbase Server
  2. MB-47595

UI: Charts in QWB has issues with lowest and highest value on Y axis being plotted

    XMLWordPrintable

Details

    • Bug
    • Resolution: Not a Bug
    • Major
    • 7.0.2, 7.1.0
    • 7.0.1, 7.1.0
    • query_tools, UI
    • None
    • Triaged
    • 1
    • Unknown

    Description

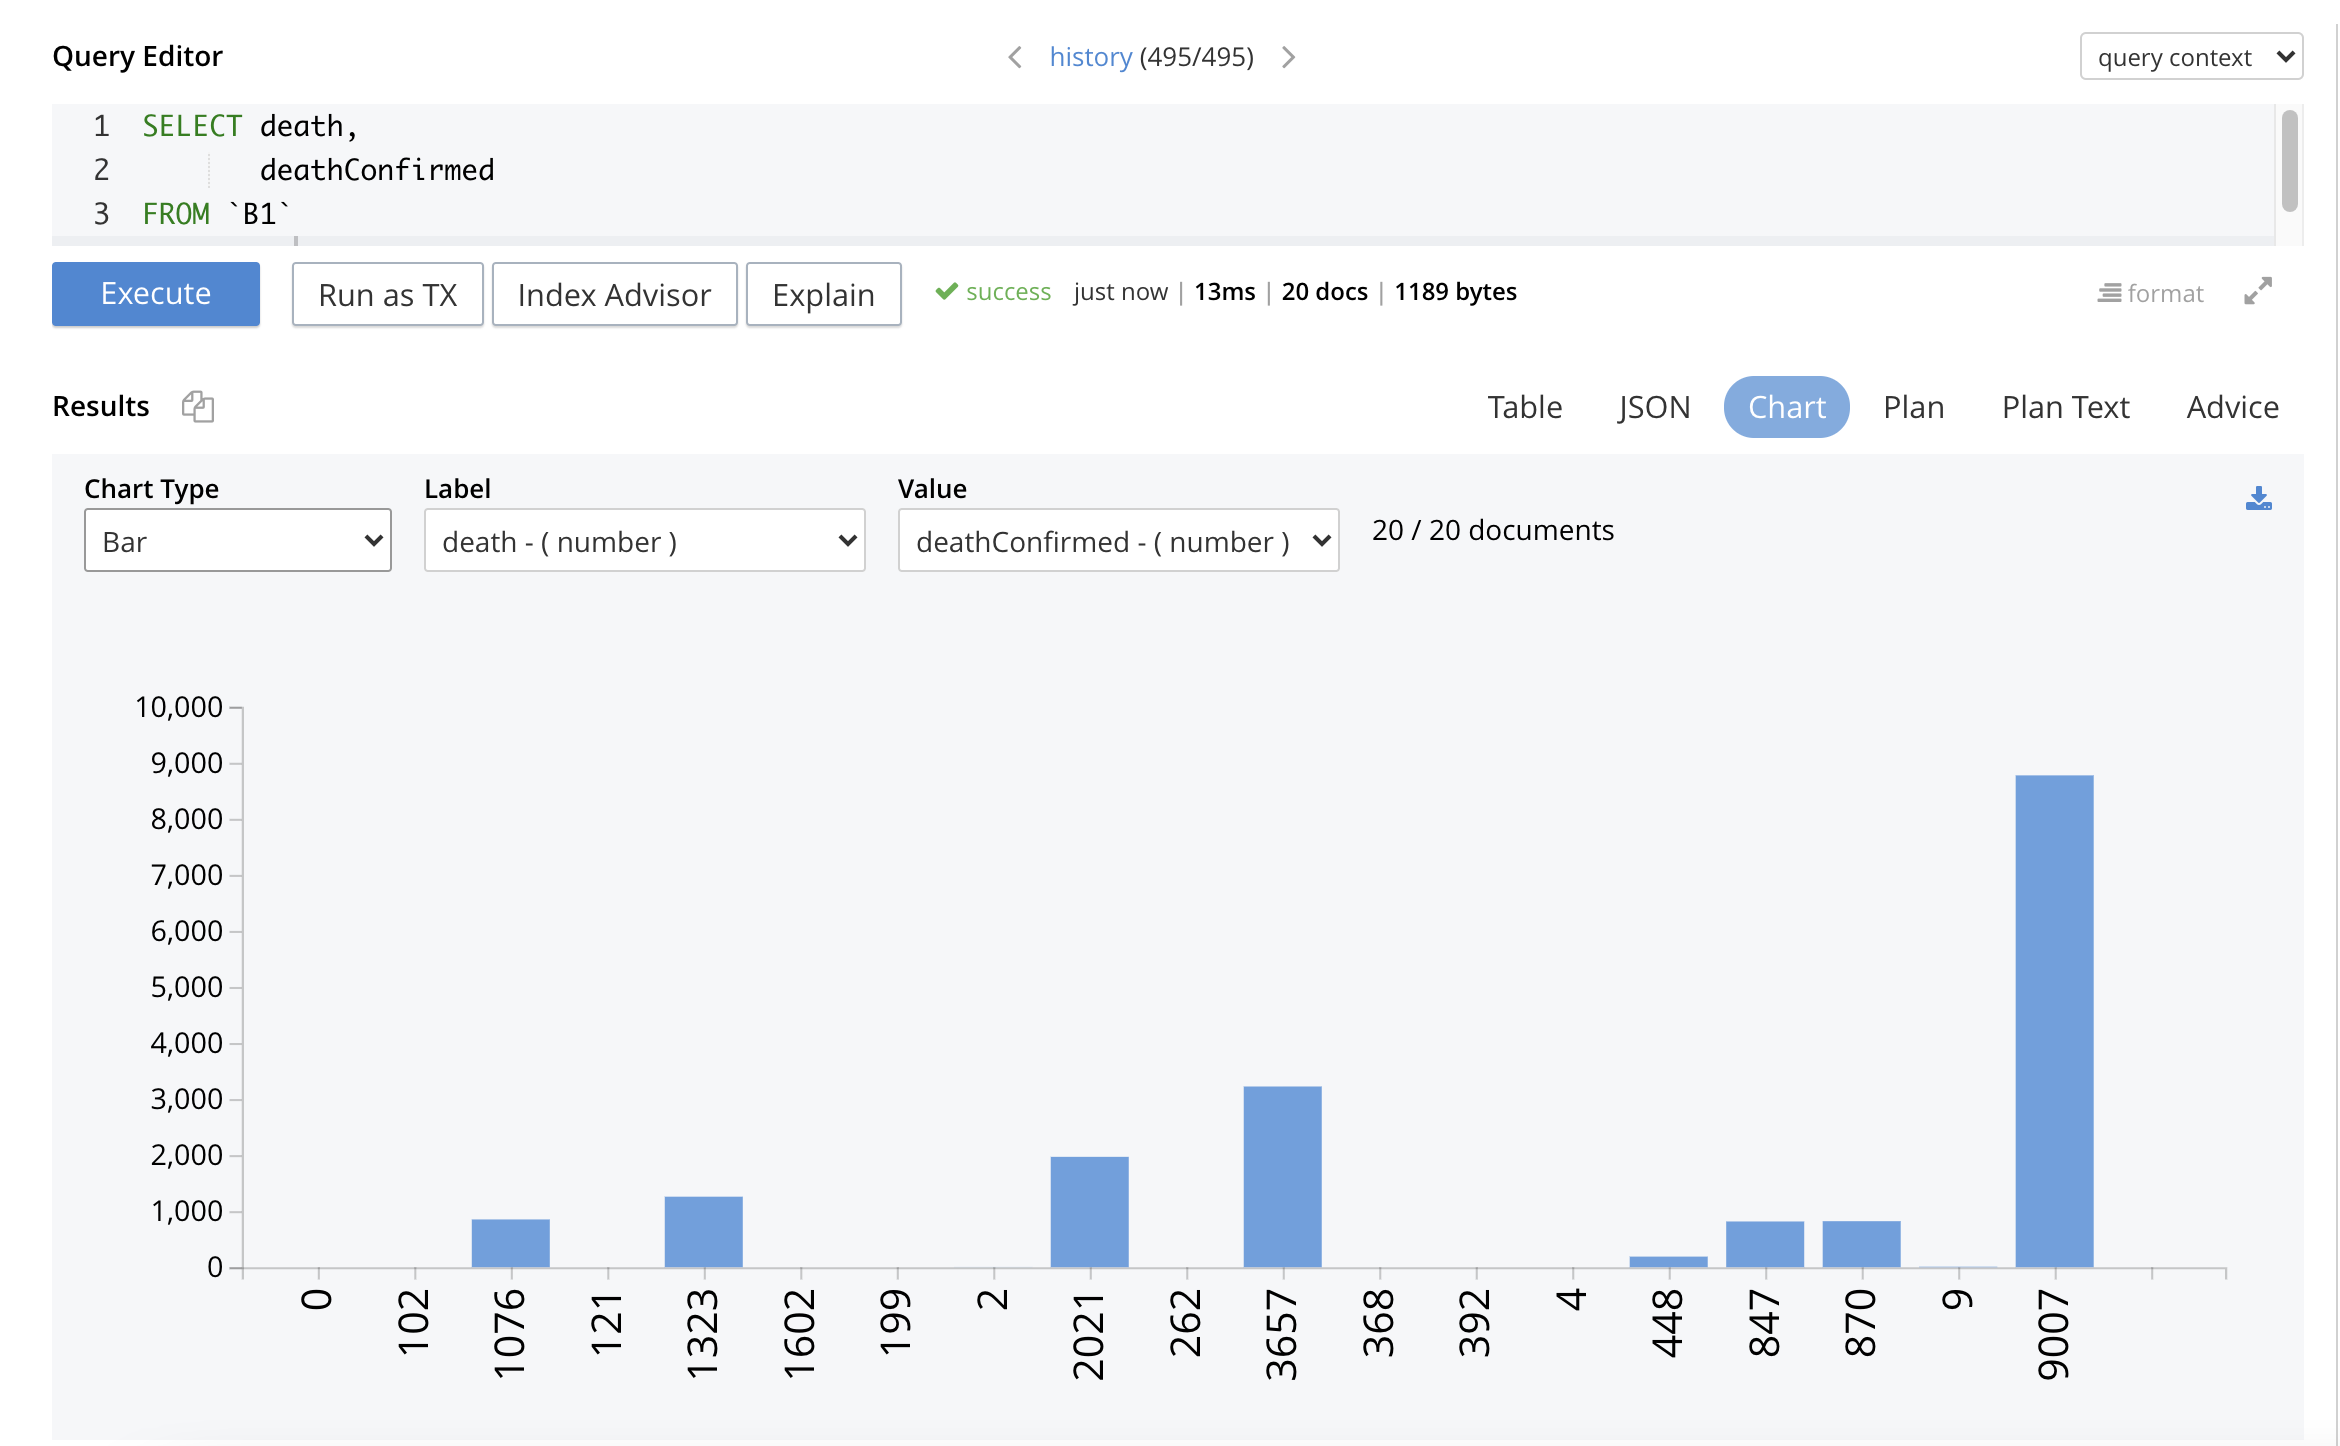
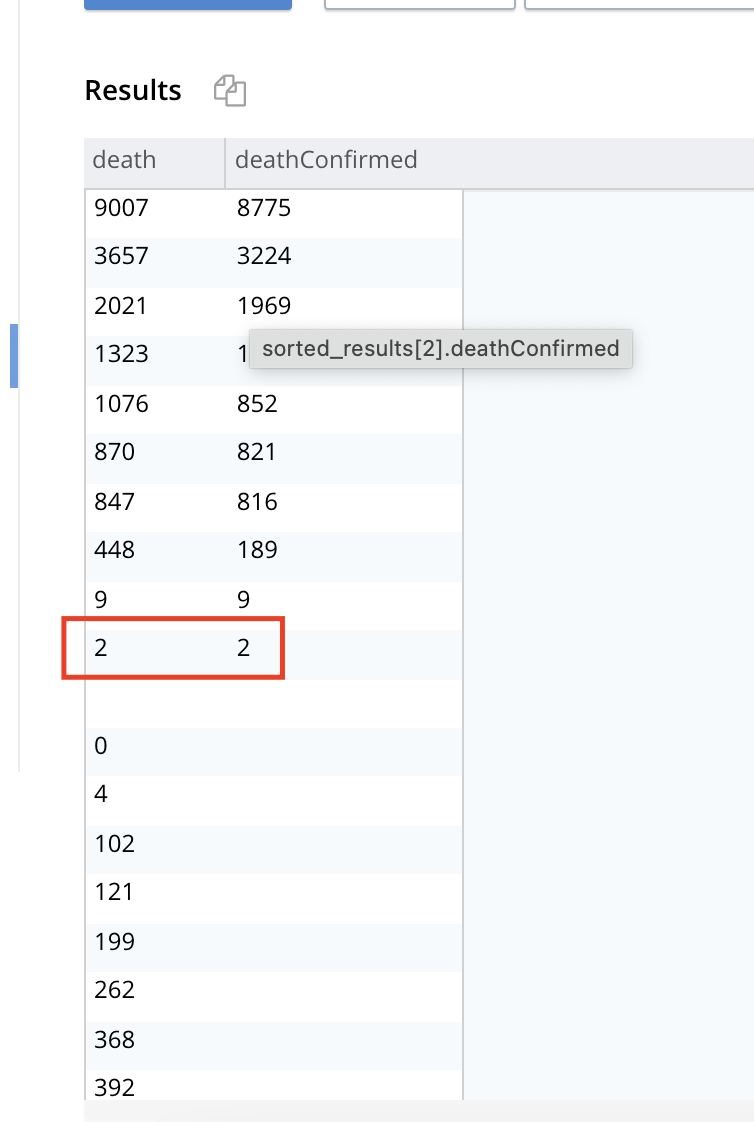
      Value doesn't show up in charts. Y scale band removes the lowest value. This is for bar charts explicitly.
      This is because the band difference between min and Max is very high.

      Attachments

        No reviews matched the request. Check your Options in the drop-down menu of this sections header.

        Activity

          People

            eben Eben Haber
            isha Isha Kandaswamy (Inactive)
            Votes:
            0 Vote for this issue
            Watchers:
            5 Start watching this issue

            Dates

              Created:
              Updated:
              Resolved:

              Gerrit Reviews

                There are no open Gerrit changes

                PagerDuty