Details
-
Bug
-
Resolution: Duplicate
-
 Major
Major
-
7.2.0
-
Enterprise Edition 7.2.0 build 5286
-
Untriaged
-
0
-
Unknown
Description
Supportal: https://supportal.couchbase.com/snapshot/2f8a3f63cbb7b06601ba1dc4d878a8e2::0
Seeing quite a few timeout messages.
172.23.97.100 : query |
|
|
Sample result for error message ' read tcp 172.23.97.67:38926->172.23.106.171:9101: i/o timeout read tcp 172.23.97.67:41948->172.23.97.108:9101: i/o timeout from [172.23.97.108:9101 172.23.106.171:9101]' at time 2023-04-03T04:42:23.532-07:00: [{u'completed_requests': {u'optimizerEstimates': None, u'n1qlFeatCtrl': 76, u'userAgent': u'python-requests/2.7.0 Jython/2.7.0 Java/1.8.0_332', u'errorCount': 1, u'errors': [{u'code': 5000, u'icause': u' read tcp 172.23.97.67:38926->172.23.106.171:9101: i/o timeout read tcp 172.23.97.67:41948->172.23.97.108:9101: i/o timeout from [172.23.97.108:9101 172.23.106.171:9101]', u'message': u' read tcp 172.23.97.67:38926->172.23.106.171:9101: i/o timeout read tcp 172.23.97.67:41948->172.23.97.108:9101: i/o timeout from [172.23.97.108:9101 172.23.106.171:9101]', u'caller': u'secondary_index:1898', u'key': u'Internal Error'}], u'phaseOperators': {u'authorize': 1, u'stream': 1, u'filter': 1, u'indexScan': 1, u'fetch': 1, u'delete': 1}, u'txid': u'06649152 |
-081f-482b-bbd4-7adce60ea81d', u'elapsedTime': u'12m2.745912226s', u'state': u'completed', u'serviceTime': u'12m2.745819059s', u'statement': u'delete from `default`:`bucket3`.`scope_3`.`coll_4` where free_breakfast=True limit 200', u'requestId': u'6e5eb4ed-70c9-4b2f-8d03-b490bef0a78d', u'node': u'172.23.97.67:8091', u'users': u'Administrator', u'statementType': u'DELETE', u'resultSize': 0, u'resultCount': 0, u'requestTime': u'2023-04-03T04:42:23.532-07:00', u'useCBO': True, u'transactionElapsedTime': u'12m2.769019605s', u'scanConsistency': u'scan_plus', u'phaseTimes': {u'authorize': u'1.306234ms', u'parse': u'787.287\xb5s', u'run': u'12m2.739964432s', u'stream': u'4.272\xb5s', u'instantiate': u'34.692\xb5s', u'filter': u'16.377\xb5s', u'plan': u'4.979972ms', u'indexScan': u'12m2.73841821s', u'fetch': u'9.956\xb5s', u'delete': u'9.937\xb5s'}, u'remoteAddr': u'172.23.106.127:33684', u'transactionRemainingTime': u'7m3.230914054s'}}] |
|
|
|
|
172.23.97.100 : query |
|
|
Sample result for error message ' read tcp 172.23.97.67:56982->172.23.105.122:9101: i/o timeout from [172.23.105.122:9101]' at time 2023-04-03T04:45:45.159-07:00: [{u'completed_requests': {u'optimizerEstimates': {u'cardinality': 137624.8190468445, u'cost': 1173459.8513670836}, u'n1qlFeatCtrl': 76, u'userAgent': u'python-requests/2.7.0 Jython/2.7.0 Java/1.8.0_332', u'errorCount': 1, u'errors': [{u'code': 5000, u'icause': u' read tcp 172.23.97.67:56982->172.23.105.122:9101: i/o timeout from [172.23.105.122:9101]', u'message': u' read tcp 172.23.97.67:56982->172.23.105.122:9101: i/o timeout from [172.23.105.122:9101]', u'caller': u'secondary_index:1898', u'key': u'Internal Error'}], u'phaseOperators': {u'authorize': 1, u'project': 1, u'stream': 1, u'filter': 1, u'indexScan': 1, u'fetch': 1}, u'txid': u'3c77cfc6-2209-49ff-b2aa-7b9b162e0fc4', u'elapsedTime': u'14m19.142758462s', u'state': u'completed', u'serviceTime': u'14m19.142622583s', u'statement': u'SELECT * FROM `default`:`bucket3`. |
`scope_5`.`coll_9` AS d WHERE ANY r IN d.reviews SATISFIES r.ratings.Rooms = 3 and r.ratings.Cleanliness > 1 END AND free_parking = True', u'requestId': u'1d5e3e25-02ee-454f-af0f-3029e1166de6', u'node': u'172.23.97.67:8091', u'users': u'Administrator', u'statementType': u'SELECT', u'resultSize': 0, u'resultCount': 0, u'requestTime': u'2023-04-03T04:45:45.159-07:00', u'useCBO': True, u'transactionElapsedTime': u'14m19.176703385s', u'scanConsistency': u'scan_plus', u'phaseTimes': {u'authorize': u'1.395324ms', u'parse': u'1.886124ms', u'run': u'14m5.953244961s', u'stream': u'4.355\xb5s', u'project': u'39.803\xb5s', u'instantiate': u'33.672\xb5s', u'filter': u'28.501\xb5s', u'plan': u'13.187383746s', u'indexScan': u'14m5.951512603s', u'fetch': u'11.942\xb5s'}, u'remoteAddr': u'172.23.106.127:58286', u'transactionRemainingTime': u'2m7.823209871s'}}] |
|
|
|
|
172.23.97.100 : query |
|
|
Sample result for error message 'GSI Drop()' at time 2023-04-03T04:44:48.322-07:00: [{u'completed_requests': {u'node': u'172.23.97.100:8091', u'users': u'Administrator', u'state': u'completed', u'errors': [{u'code': 5000, u'icause': u'Fail to drop index on some indexer nodes. Error=Request timed out. Index server may still be processing this request. Please check the status after sometime or retry.\n. If cluster or indexer is currently unavailable, the operation will automatically retry after cluster is back to normal.', u'message': u'GSI Drop()', u'caller': u'secondary_index:1062', u'key': u'Internal Error'}], u'scanConsistency': u'unbounded', u'requestTime': u'2023-04-03T04:44:48.322-07:00', u'statementType': u'DROP_INDEX', u'phaseOperators': {u'authorize': 1, u'stream': 1}, u'serviceTime': u'2m40.180794894s', u'remoteAddr': u'172.23.106.127:36128', u'elapsedTime': u'2m40.180888525s', u'resultSize': 0, u'n1qlFeatCtrl': 76, u'statement': u'DROP INDEX `idx8_P8LQ1C7FZX_idxprefix` on |
`bucket4`.`_default`.`_default`;', u'requestId': u'b46140da-c030-42e4-9648-ec1b1681f139', u'clientContextID': u'2b3abea0d970209d', u'userAgent': u'libcouchbase/3.0.6 (Linux-5.10.76-linuxkit; x86_64; GNU 9.4.0) PYCBC/3.0.10', u'useCBO': True, u'resultCount': 0, u'errorCount': 1, u'phaseTimes': {u'authorize': u'2.336138ms', u'run': u'2m40.17611155s', u'stream': u'18.678\xb5s', u'instantiate': u'19.549\xb5s', u'parse': u'609.836\xb5s', u'plan': u'4.015229ms'}}}] |
|
|
|
|
172.23.97.100 : query |
|
|
Sample result for error message 'Index scan timed out' at time 2023-04-03T04:44:50.079-07:00: [{u'completed_requests': {u'optimizerEstimates': None, u'n1qlFeatCtrl': 76, u'userAgent': u'python-requests/2.7.0 Jython/2.7.0 Java/1.8.0_332', u'errorCount': 1, u'errors': [{u'code': 12015, u'icause': u' Index scan timed out', u'message': u'Index scan timed out', u'caller': u'secondary_index:1891', u'key': u'datastore.couchbase.index_scan_timeout'}], u'phaseOperators': {u'authorize': 1, u'project': 1, u'stream': 1, u'sort': 1, u'filter': 1, u'indexScan': 1}, u'txid': u'd283f2a5-db4d-4863-bc6b-fcd805925458', u'elapsedTime': u'2m5.551614262s', u'state': u'completed', u'serviceTime': u'2m5.551494155s', u'statement': u'SELECT h.name,h.country,h.city,h.price,DENSE_RANK() OVER (window1) AS `rank` FROM `default`:`bucket3`.`scope_0`.`coll_15` AS h WHERE h.price IS NOT NULL WINDOW window1 AS ( PARTITION BY h.country ORDER BY h.price NULLS LAST) LIMIT 10;', u'requestId': u'ef010326-6874-4ee2-89ed-e57 |
f417e5f51', u'node': u'172.23.97.67:8091', u'users': u'Administrator', u'phaseCounts': {u'filter': 776343, u'sort': 776343, u'indexScan': 776343}, u'statementType': u'SELECT', u'resultSize': 995, u'resultCount': 10, u'requestTime': u'2023-04-03T04:44:50.079-07:00', u'useCBO': True, u'transactionElapsedTime': u'2m41.143157319s', u'scanConsistency': u'unbounded', u'phaseTimes': {u'authorize': u'42.852\xb5s', u'parse': u'2.400815ms', u'run': u'2m5.535661424s', u'stream': u'175.055\xb5s', u'project': u'208.889\xb5s', u'instantiate': u'38.89\xb5s', u'sort': u'5.231616832s', u'filter': u'3.729127458s', u'plan': u'13.282393ms', u'indexScan': u'2m0.014885618s'}, u'remoteAddr': u'172.23.106.127:45985', u'transactionRemainingTime': u'16m42.856741153s'}}] |
|
|
|
|
172.23.97.100 : query |
|
|
Sample result for error message 'Error getting documents for update statistics. |
Failed to get random document.' at time 2023-04-03T04:24:49.353-07:00: [{u'completed_requests': {u'optimizerEstimates': None, u'n1qlFeatCtrl': 76, u'userAgent': u'libcouchbase/3.0.6 (Linux-5.10.76-linuxkit; x86_64; GNU 9.4.0) PYCBC/3.0.10', u'errorCount': 1, u'errors': [{u'code': 5360, u'message': u'Error getting documents for update statistics.\nFailed to get random document.', u'caller': u'upd_statistics:372', u'key': u'execution.update_statistics'}], u'phaseOperators': {u'authorize': 1, u'stream': 1}, u'elapsedTime': u'35.022005859s', u'state': u'completed', u'clientContextID': u'79459e958fc062ad', u'serviceTime': u'35.02191978s', u'statement': u"UPDATE STATISTICS FOR `bucket1`.`scope_3`.`coll_17` INDEX ALL WITH {'update_statistics_timeout': 0} ;", u'requestId': u'71c14c45-10c5-46dc-a8be-a7a617f517d0', u'node': u'172.23.97.67:8091', u'users': u'Administrator', u'statementType': u'UPDATE_STATISTICS', u'resultSize': 0, u'resultCount': 0, u'requestTime': u'2023-04-03T04:24:49.353-07 |
:00', u'useCBO': True, u'scanConsistency': u'unbounded', u'remoteAddr': u'172.23.106.127:35220', u'phaseTimes': {u'authorize': u'27.4\xb5s', u'run': u'35.021204684s', u'stream': u'3.383\xb5s', u'instantiate': u'28.339\xb5s', u'parse': u'632.071\xb5s', u'plan': u'25.454\xb5s'}}}] |
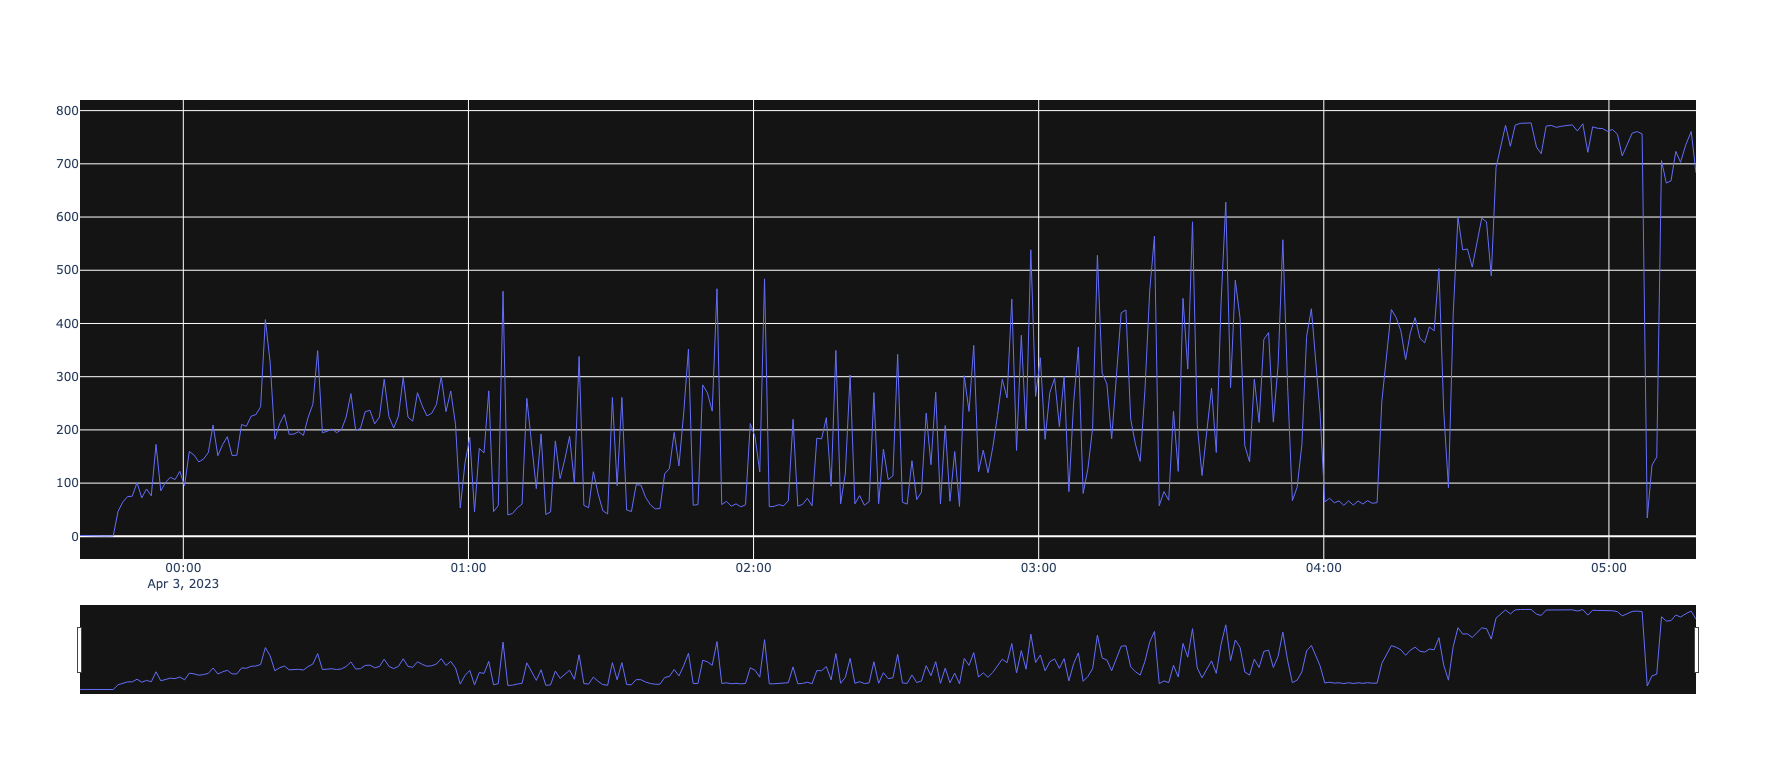
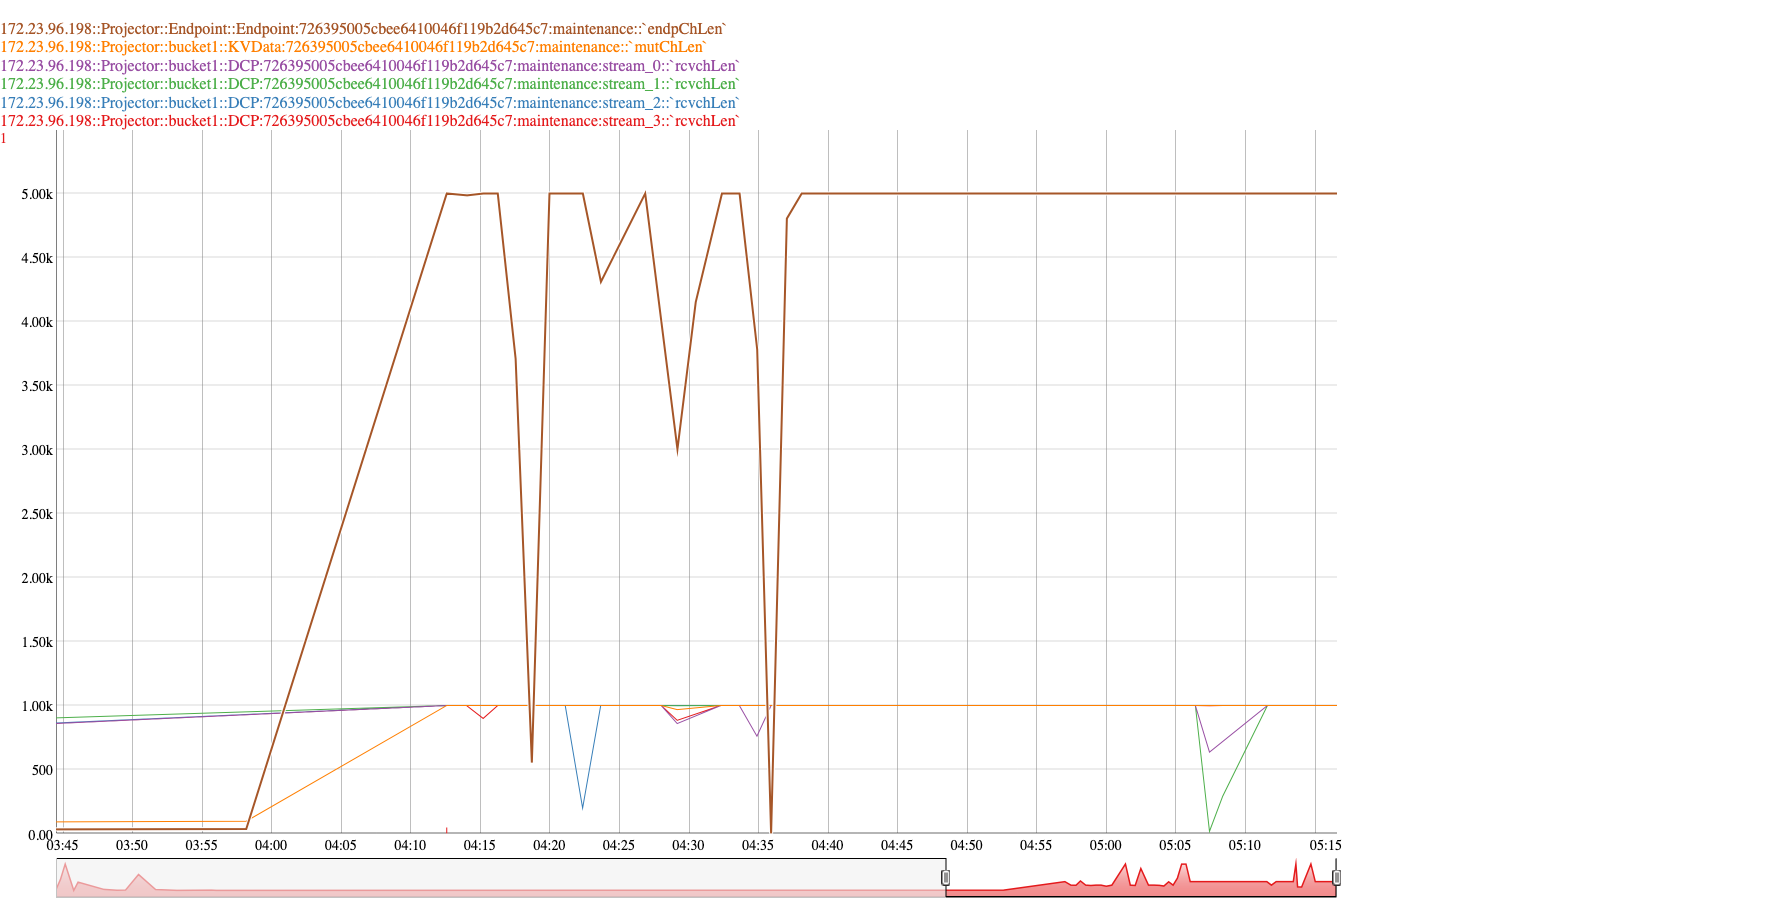
These timeout issues started around 2023-04-03T04:00:00 and we have been seeing these issues even in the latest iterations ( about 15 hours afterwards). I just checked the CPU usage and it's over 90% for about 5 hours starting from the time we started seeing i/o timeout errors.
Not really sure if it's due to high memory usage alluded to in this comment
cbcollect ->
url : https://cb-jira.s3.us-east-2.amazonaws.com/logs/systestmon-1680524083/collectinfo-2023-04-03T121447-ns_1%40172.23.105.122.zip |
url : https://cb-jira.s3.us-east-2.amazonaws.com/logs/systestmon-1680524083/collectinfo-2023-04-03T121447-ns_1%40172.23.106.171.zip |
url : https://cb-jira.s3.us-east-2.amazonaws.com/logs/systestmon-1680524083/collectinfo-2023-04-03T121447-ns_1%40172.23.106.30.zip |
url : https://cb-jira.s3.us-east-2.amazonaws.com/logs/systestmon-1680524083/collectinfo-2023-04-03T121447-ns_1%40172.23.96.198.zip |
url : https://cb-jira.s3.us-east-2.amazonaws.com/logs/systestmon-1680524083/collectinfo-2023-04-03T121447-ns_1%40172.23.96.230.zip |
url : https://cb-jira.s3.us-east-2.amazonaws.com/logs/systestmon-1680524083/collectinfo-2023-04-03T121447-ns_1%40172.23.96.245.zip |
url : https://cb-jira.s3.us-east-2.amazonaws.com/logs/systestmon-1680524083/collectinfo-2023-04-03T121447-ns_1%40172.23.97.100.zip |
url : https://cb-jira.s3.us-east-2.amazonaws.com/logs/systestmon-1680524083/collectinfo-2023-04-03T121447-ns_1%40172.23.97.108.zip |
url : https://cb-jira.s3.us-east-2.amazonaws.com/logs/systestmon-1680524083/collectinfo-2023-04-03T121447-ns_1%40172.23.97.109.zip |
url : https://cb-jira.s3.us-east-2.amazonaws.com/logs/systestmon-1680524083/collectinfo-2023-04-03T121447-ns_1%40172.23.97.66.zip |
url : https://cb-jira.s3.us-east-2.amazonaws.com/logs/systestmon-1680524083/collectinfo-2023-04-03T121447-ns_1%40172.23.97.67.zip |
Attachments
Issue Links
- relates to
-
MB-36311 Ensure quality of service for incremental traffic during initial build
-
- Open
-