Details
-
Bug
-
Resolution: Fixed
-
Major
-
6.5.0
-
Untriaged
-
Yes
-
KV-Engine Mad-Hatter GA, KV Sprint 2020-January
Description
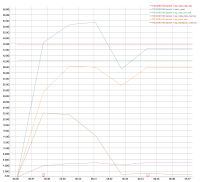
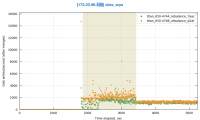
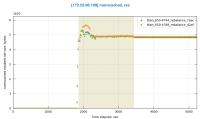
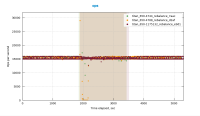
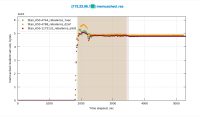
I noticed this in the most recent 9->9 swap rebalance test against 6.5.0-4788: http://cbmonitor.sc.couchbase.com/reports/html/?snapshot=titan_650-4788_rebalance_d2af#19046bfb651c6e0796fef70b7b4a833b.
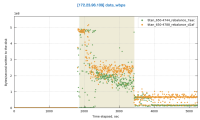
I downloaded some of the logs and looked at mortimer and indeed across the cluster the ops go to zero from around 5:38:52 to 5:41:52:
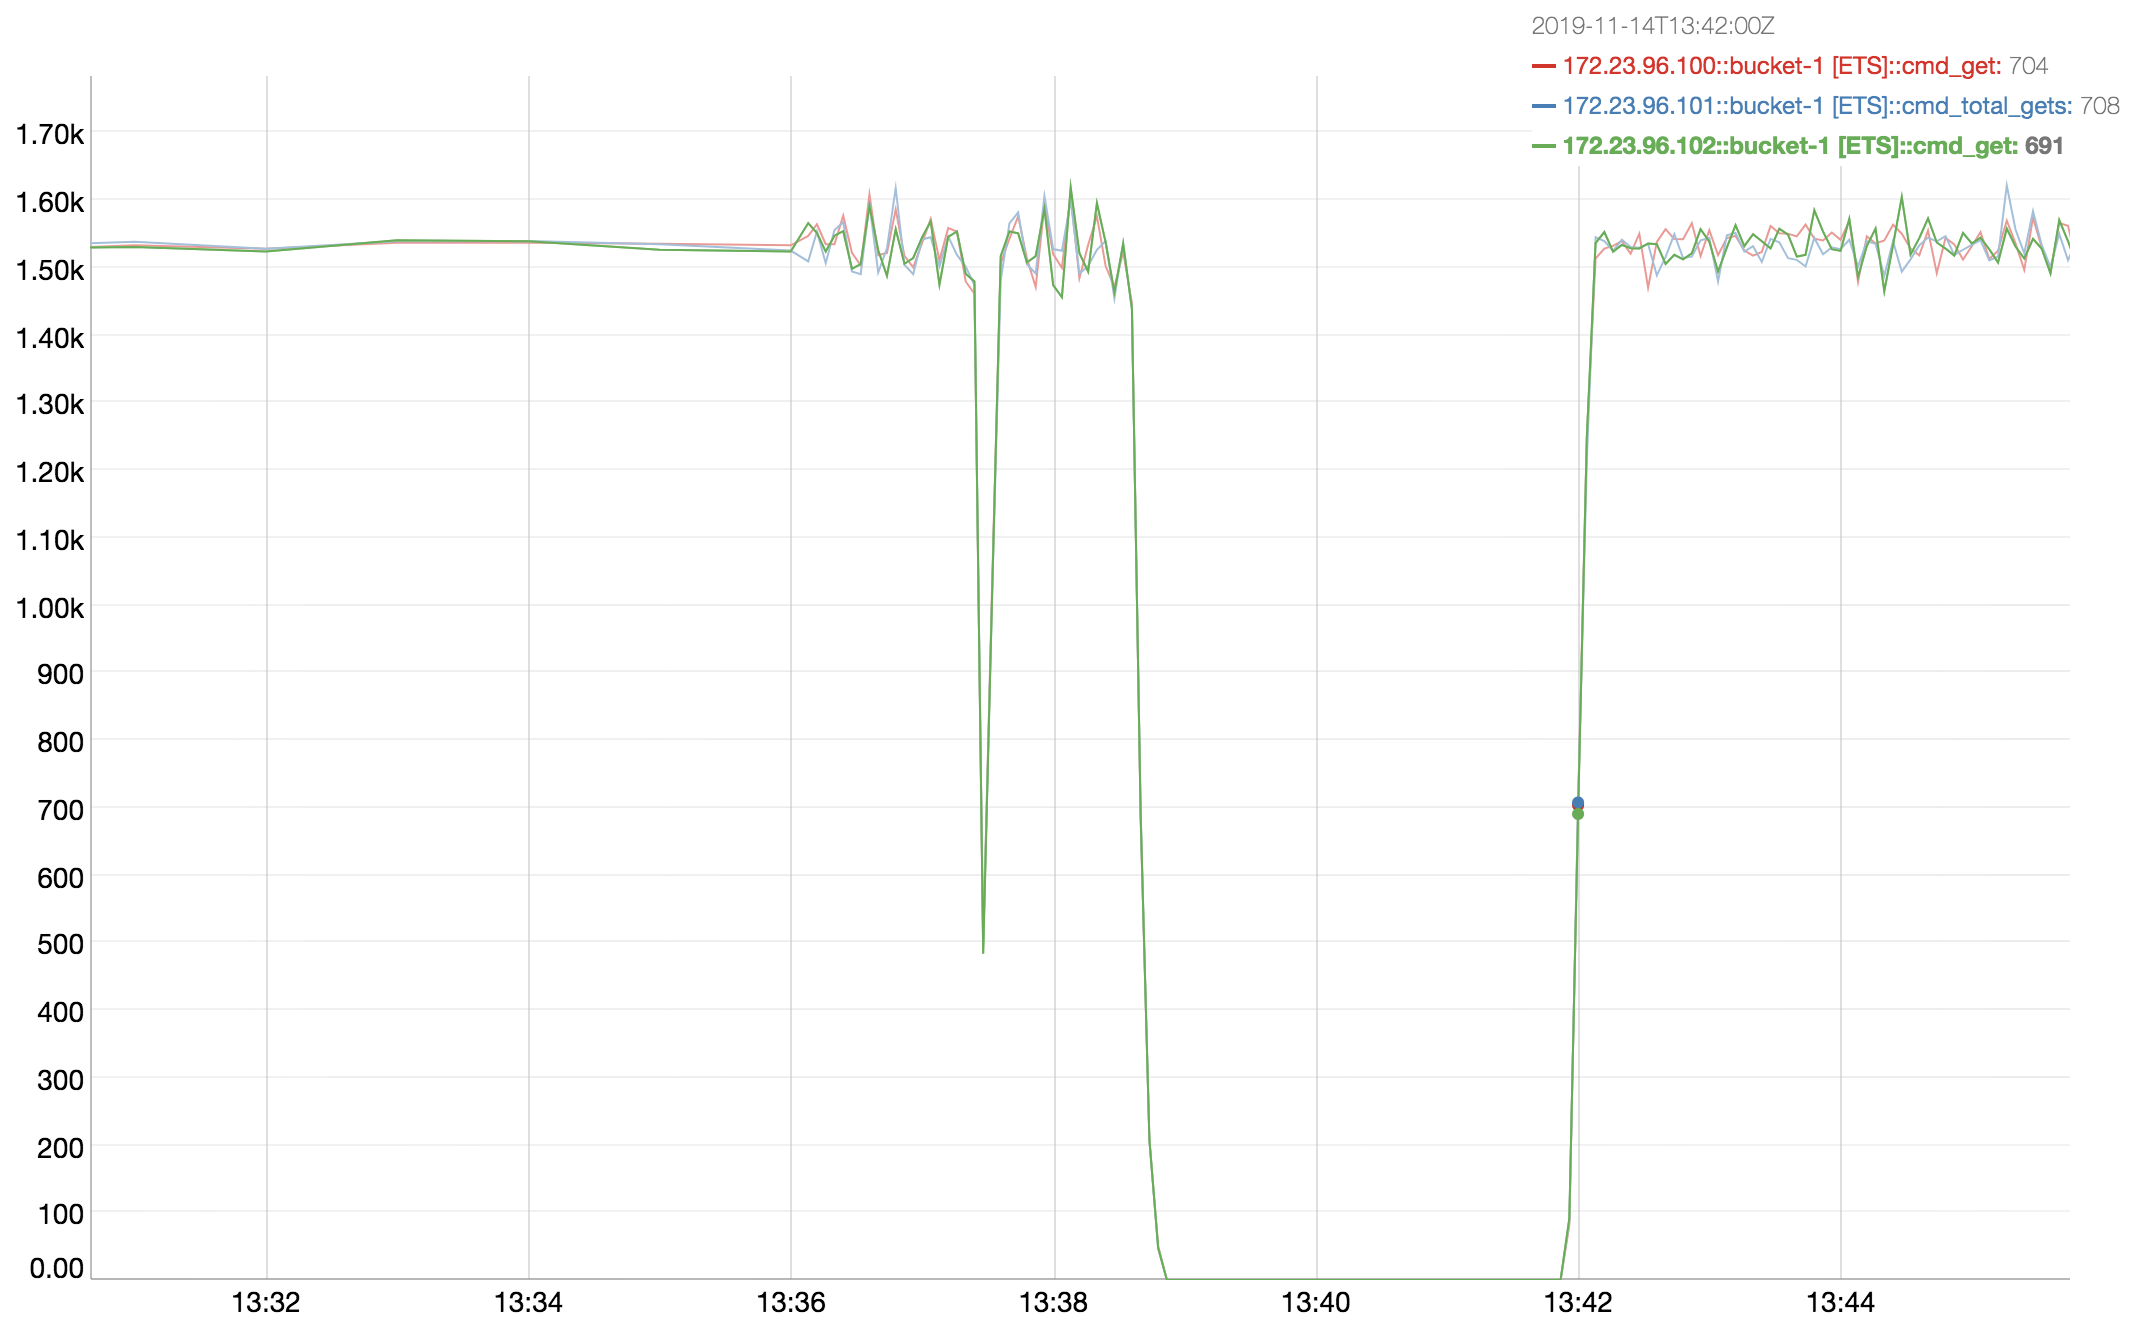
(Note that the mortimer timestamps are in GMT - 8 hours ahead of the timestamps in the logs.)
We don't see this in the previous build that was tested 6.5.0-4744: http://cbmonitor.sc.couchbase.com/reports/html/?snapshot=titan_650-4788_rebalance_d2af&label=%226.5.0-4788%209-%3E9%20swap%20rebalance%22&snapshot=titan_650-4744_rebalance_7aac&label=%226.5.0-4744%209-%3E9%20swap%20rebalance%22#19046bfb651c6e0796fef70b7b4a833b.
This occurs during the early part of the rebalance when we're moving a lot of replicas. With the sharding change we're able to move even more replicas.
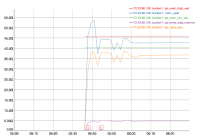
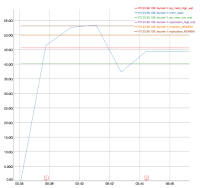
At first I thought it might be CPU, but CPU is only high on node .109 that's getting rebalanced in (where the CPU hits about 50%.) Then I thought the drop might possibly be related to compaction, but I didn't see evidence of compaction during this time.
Then I noticed these messages in the logs approximately during this time:
2019-11-14T05:36:09.885569-08:00 INFO (bucket-1) DCP (Producer) eq_dcpq:replication:ns_1@172.23.96.100->ns_1@172.23.96.109:bucket-1 - Notifying paused connection now that DcpProducer::BufferLog is no longer full; ackedBytes:52429522, bytesSent:0, maxBytes:52428800
|
2019-11-14T05:36:12.816088-08:00 INFO (bucket-1) DCP (Producer) eq_dcpq:replication:ns_1@172.23.96.100->ns_1@172.23.96.109:bucket-1 - Notifying paused connection now that DcpProducer::BufferLog is no longer full; ackedBytes:104858323, bytesSent:0, maxBytes:52428800
|
2019-11-14T05:36:15.658150-08:00 INFO (bucket-1) DCP (Producer) eq_dcpq:replication:ns_1@172.23.96.100->ns_1@172.23.96.109:bucket-1 - Notifying paused connection now that DcpProducer::BufferLog is no longer full; ackedBytes:157287648, bytesSent:0, maxBytes:52428800
|
...
|
Basically every couple of seconds the replication queue between 100 and 109 gets full, then gets unblocked and can continue. These logs occur a minute or two before the ops drop to zero and then cease right around the times the ops start going again.
$ fgrep "Notifying paused connectio" memcached.log | grep -o "2019-11-14T..:..:" | uniq -c
|
54 2019-11-14T05:36:
|
26 2019-11-14T05:37:
|
23 2019-11-14T05:38:
|
79 2019-11-14T05:39:
|
12 2019-11-14T05:40:
|
27 2019-11-14T05:41:
|
11 2019-11-14T05:42:
|
Similar logs at the same time occur on all the nodes. E.g. on node .101:
$ fgrep "Notifying paused connectio" memcached.log | grep -o "2019-11-14T..:..:" |uniq -c
|
56 2019-11-14T05:36:
|
31 2019-11-14T05:37:
|
25 2019-11-14T05:38:
|
79 2019-11-14T05:39:
|
17 2019-11-14T05:40:
|
14 2019-11-14T05:41:
|
However, it turns out that we also see these traces on 4744. It's just that there's a slightly smaller number of them (222 vs 210) and they occur over 8 minutes not 7.
$ fgrep "Notifying paused connectio" memcached.log | grep -o "2019-11-..T..:..:" | uniq -c
|
56 2019-11-04T15:33:
|
21 2019-11-04T15:34:
|
36 2019-11-04T15:35:
|
23 2019-11-04T15:36:
|
18 2019-11-04T15:37:
|
14 2019-11-04T15:38:
|
28 2019-11-04T15:39:
|
14 2019-11-04T15:40:
|
At any rate, the ops shouldn't go to zero.
6.5.0-4744 job: http://perf.jenkins.couchbase.com/job/titan-reb/927/
6.5.0-4788 job: http://perf.jenkins.couchbase.com/job/titan-reb/947/
Attachments
| For Gerrit Dashboard: MB-36926 | ||||||
|---|---|---|---|---|---|---|
| # | Subject | Branch | Project | Status | CR | V |
| 118065,10 | MB-36926: Remove Vbid from IORequest | mad-hatter | kv_engine | Status: MERGED | +2 | +1 |
| 118066,10 | MB-36926: Remove ids vector from CouchKVStore | mad-hatter | kv_engine | Status: MERGED | +2 | +1 |
| 118193,3 | MB-36926: Don't oversize actions buffer in update_indexes | master | couchstore | Status: ABANDONED | 0 | -1 |
| 118194,3 | MB-36926: Reuse idacts for seqacts | master | couchstore | Status: ABANDONED | 0 | -1 |
| 118225,10 | MB-36926: Drop queued_items vector before commit when flushing | mad-hatter | kv_engine | Status: MERGED | +2 | +1 |
| 118970,3 | MB-36926: Do not always attempt to run RocksDB flush benchmark | mad-hatter | kv_engine | Status: MERGED | +2 | +1 |
| 118971,12 | MB-36926: Remove PersistenceCallback from IORequest | mad-hatter | kv_engine | Status: MERGED | +2 | +1 |
| 118972,8 | MB-36926: Reduce indentation of EPBucket::flushVBucket | mad-hatter | kv_engine | Status: MERGED | +2 | +1 |
| 119303,2 | MB-36926: Add FETCH_INSERT modify action | master | couchstore | Status: ABANDONED | 0 | -1 |
| 119306,1 | MB-36926: Remove C linkage from couch_btree.h | master | couchstore | Status: ABANDONED | 0 | -1 |
| 119307,2 | MB-36926: Use a PackedPtr for the type of a couchfile_modify_action | master | couchstore | Status: ABANDONED | 0 | -1 |
| 119381,1 | MB-36926: WIP: Swap pendingReqsQ to map and remove keystats | mad-hatter | kv_engine | Status: ABANDONED | -2 | -1 |
| 119420,7 | MB-36926: Swap kvstats_ctx map to unordered_set | mad-hatter | kv_engine | Status: MERGED | +2 | +1 |
| 119440,7 | MB-36926: Add flusher replace benchmarks | mad-hatter | kv_engine | Status: MERGED | +2 | +1 |
| 119496,2 | Merge branch 'mad-hatter' | master | kv_engine | Status: MERGED | +2 | +1 |
| 119547,1 | Merge branch 'mad-hatter' | master | kv_engine | Status: MERGED | +2 | +1 |
| 119582,1 | Merge remote-tracking branch 'couchbase/mad-hatter' | master | kv_engine | Status: MERGED | +2 | +1 |
| 119662,1 | MB-36926: Remove Vbid from IORequest | master | kv_engine | Status: ABANDONED | 0 | 0 |
| 119897,5 | Merge remote-tracking branch 'couchbase/mad-hatter' | master | kv_engine | Status: MERGED | +2 | +1 |
| 120029,4 | MB-36926: Don't oversize actions buffer in update_indexes | mad-hatter | couchstore | Status: MERGED | +2 | +1 |
| 120031,5 | MB-36926: Add FETCH_INSERT modify action | mad-hatter | couchstore | Status: MERGED | +2 | +1 |
| 120032,5 | MB-36926: Reuse idacts for seqacts | mad-hatter | couchstore | Status: MERGED | +2 | +1 |
| 120033,5 | MB-36926: Remove C linkage from couch_btree.h | mad-hatter | couchstore | Status: MERGED | +2 | +1 |
| 120034,8 | MB-36926: Use a PackedPtr for the type of a couchfile_modify_action | mad-hatter | couchstore | Status: MERGED | +2 | +1 |
| 120043,5 | Merge branch 'couchbase/mad-hatter' | master | kv_engine | Status: ABANDONED | 0 | -1 |
| 120077,7 | Merge branch 'mad-hatter' | master | kv_engine | Status: MERGED | +2 | +1 |
| 120164,1 | Merge branch 'mad-hatter' | master | kv_engine | Status: MERGED | +2 | +1 |
| 120217,1 | Merge branch 'mad-hatter' | master | kv_engine | Status: MERGED | +2 | +1 |
| 120225,3 | Merge branch 'mad-hatter' | master | kv_engine | Status: MERGED | +2 | +1 |
| 120299,1 | Merge branch 'mad-hatter' | master | couchstore | Status: MERGED | +2 | +1 |
